


반응형
Stacked histogram on a log scale

seaborn components used: set_theme(), load_dataset(), despine(), histplot()
import seaborn as sns
import matplotlib as mpl
import matplotlib.pyplot as plt

sns.set_theme(style="ticks")

diamonds = sns.load_dataset("diamonds")

f, ax = plt.subplots(figsize=(7, 5))
sns.despine(f)

sns.histplot(
    diamonds,
    x="price", hue="cut",
    multiple="stack",
    palette="light:m_r",
    edgecolor=".3",
    linewidth=.5,
    log_scale=True,
)
ax.xaxis.set_major_formatter(mpl.ticker.ScalarFormatter())
ax.set_xticks([500, 1000, 2000, 5000, 10000])
Facetting histograms by subsets of data
seaborn components used: set_theme(), load_dataset(), displot()
import seaborn as sns
sns.set_theme(style="darkgrid")
df = sns.load_dataset("penguins")
sns.displot(
df, x="flipper_length_mm", col="species", row="sex",
binwidth=3, height=3, facet_kws=dict(margin_titles=True),
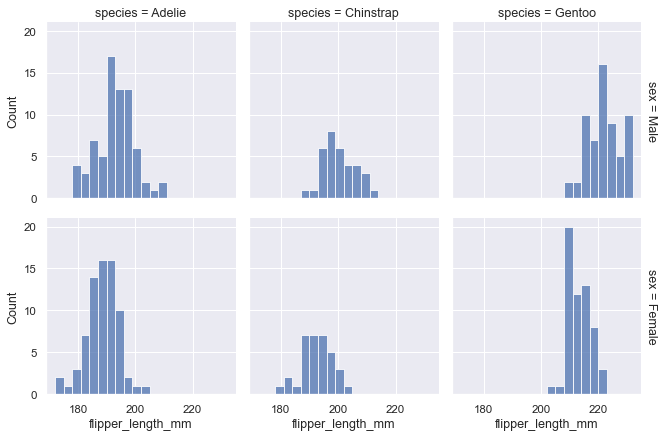
)Trivariate histogram with two categorical variables
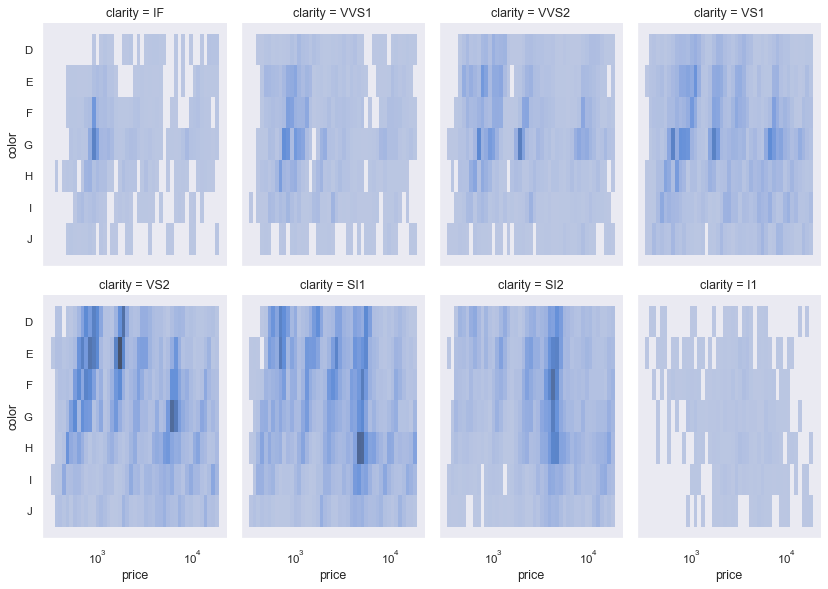
seaborn components used: set_theme(), load_dataset(), displot()
import seaborn as sns
sns.set_theme(style="dark")

diamonds = sns.load_dataset("diamonds")
sns.displot(
    data=diamonds, x="price", y="color", col="clarity",
    log_scale=(True, False), col_wrap=4, height=4, aspect=.7,
)
반응형