


반응형
Multiple bivariate KDE plots
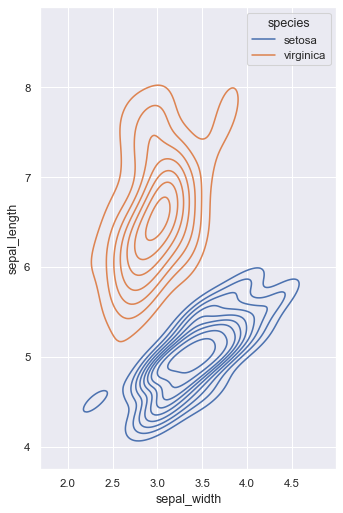
seaborn components used: set_theme(), load_dataset(), kdeplot()
import seaborn as sns
import matplotlib.pyplot as plt

sns.set_theme(style="darkgrid")
iris = sns.load_dataset("iris")

# Set up the figure
f, ax = plt.subplots(figsize=(8, 8))
ax.set_aspect("equal")

# Draw a contour plot to represent each bivariate density
sns.kdeplot(
    data=iris.query("species != 'versicolor'"),
    x="sepal_width",
    y="sepal_length",
    hue="species",
    thresh=.1,
)
Different cubehelix palettes
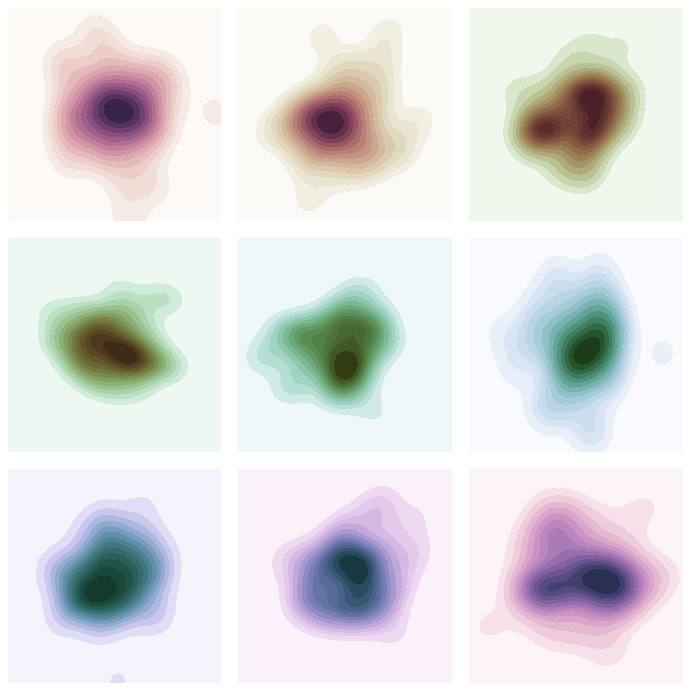
seaborn components used: set_theme(), cubehelix_palette(), kdeplot()
import numpy as np
import seaborn as sns
import matplotlib.pyplot as plt

sns.set_theme(style="white")
rs = np.random.RandomState(50)

# Set up the matplotlib figure
f, axes = plt.subplots(3, 3, figsize=(9, 9), sharex=True, sharey=True)

# Rotate the starting point around the cubehelix hue circle
for ax, s in zip(axes.flat, np.linspace(0, 3, 10)):

    # Create a cubehelix colormap to use with kdeplot
    cmap = sns.cubehelix_palette(start=s, light=1, as_cmap=True)

    # Generate and plot a random bivariate dataset
    x, y = rs.normal(size=(2, 50))
    sns.kdeplot(
        x=x, y=y,
        cmap=cmap, fill=True,
        clip=(-5, 5), cut=10,
        thresh=0, levels=15,
        ax=ax,
    )
    ax.set_axis_off()

ax.set(xlim=(-3.5, 3.5), ylim=(-3.5, 3.5))
f.subplots_adjust(0, 0, 1, 1, .08, .08)
Bivariate plot with multiple elements
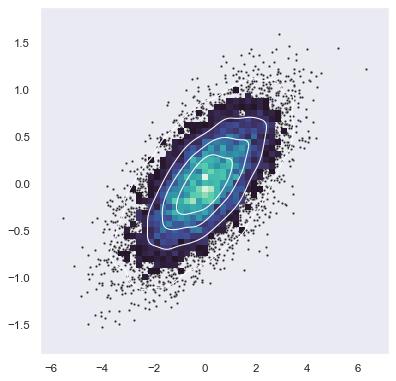
seaborn components used: set_theme(), scatterplot(), histplot(), kdeplot()
import numpy as np
import seaborn as sns
import matplotlib.pyplot as plt
sns.set_theme(style="dark")

# Simulate data from a bivariate Gaussian
n = 10000
mean = [0, 0]
cov = [(2, .4), (.4, .2)]
rng = np.random.RandomState(0)
x, y = rng.multivariate_normal(mean, cov, n).T

# Draw a combo histogram and scatterplot with density contours
f, ax = plt.subplots(figsize=(6, 6))
sns.scatterplot(x=x, y=y, s=5, color=".15")
sns.histplot(x=x, y=y, bins=50, pthresh=.1, cmap="mako")
sns.kdeplot(x=x, y=y, levels=5, color="w", linewidths=1)
반응형