


반응형
Pair Grid
Paired density and scatterplot matrix

seaborn components used: set_theme(), load_dataset(), PairGrid
import seaborn as sns
sns.set_theme(style="white")

df = sns.load_dataset("penguins")

g = sns.PairGrid(df, diag_sharey=False)
g.map_upper(sns.scatterplot, s=15)
g.map_lower(sns.kdeplot)
g.map_diag(sns.kdeplot, lw=2)
Paired categorical plots
seaborn components used: set_theme(), load_dataset(), PairGrid, despine()
import seaborn as sns
sns.set_theme(style="whitegrid")
# Load the example Titanic dataset
titanic = sns.load_dataset("titanic")
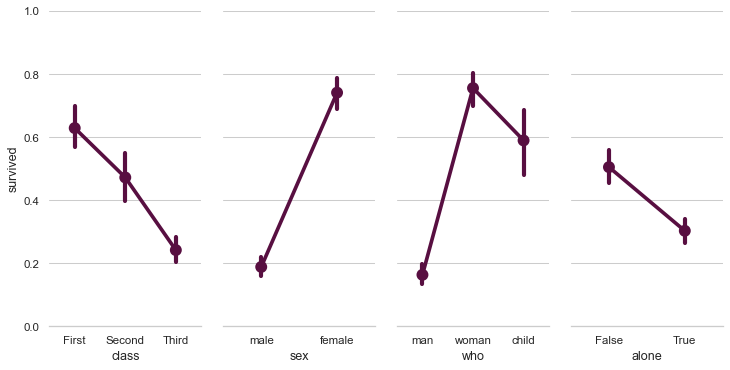
# Set up a grid to plot survival probability against several variables
g = sns.PairGrid(titanic, y_vars="survived",
x_vars=["class", "sex", "who", "alone"],
height=5, aspect=.5)
# Draw a seaborn pointplot onto each Axes
g.map(sns.pointplot, scale=1.3, errwidth=4, color="xkcd:plum")
g.set(ylim=(0, 1))
sns.despine(fig=g.fig, left=True)Dot plot with several variables
seaborn components used: set_theme(), load_dataset(), PairGrid, despine()
import seaborn as sns
sns.set_theme(style="whitegrid")
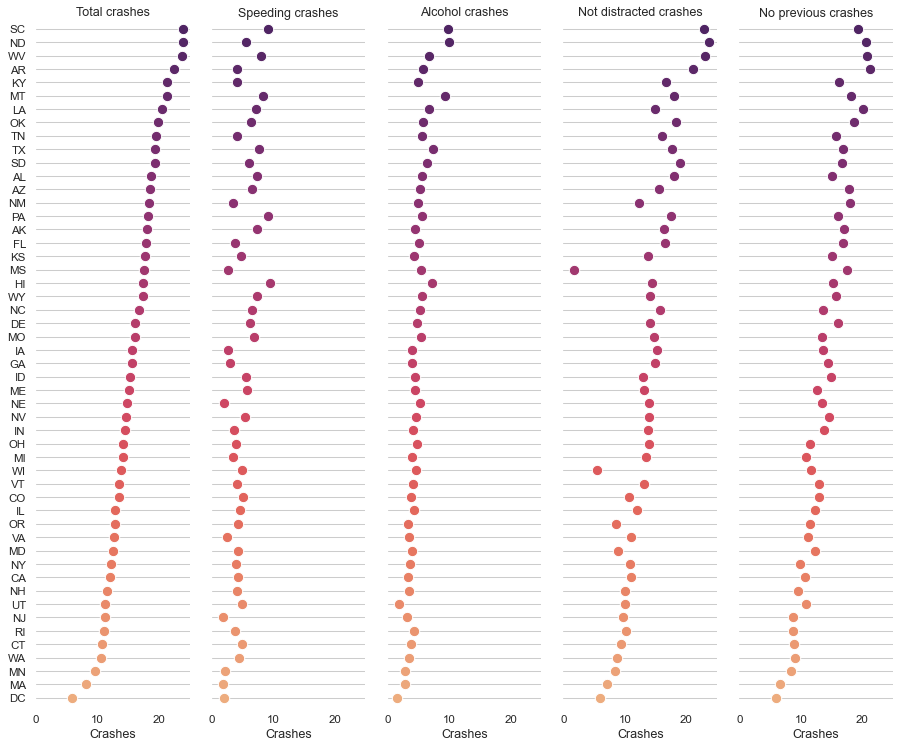
# Load the dataset
crashes = sns.load_dataset("car_crashes")
# Make the PairGrid
g = sns.PairGrid(crashes.sort_values("total", ascending=False),
x_vars=crashes.columns[:-3], y_vars=["abbrev"],
height=10, aspect=.25)
# Draw a dot plot using the stripplot function
g.map(sns.stripplot, size=10, orient="h", jitter=False,
palette="flare_r", linewidth=1, edgecolor="w")
# Use the same x axis limits on all columns and add better labels
g.set(xlim=(0, 25), xlabel="Crashes", ylabel="")
# Use semantically meaningful titles for the columns
titles = ["Total crashes", "Speeding crashes", "Alcohol crashes",
"Not distracted crashes", "No previous crashes"]
for ax, title in zip(g.axes.flat, titles):
# Set a different title for each axes
ax.set(title=title)
# Make the grid horizontal instead of vertical
ax.xaxis.grid(False)
ax.yaxis.grid(True)
sns.despine(left=True, bottom=True)
반응형