


반응형
Conditional kernel density estimate
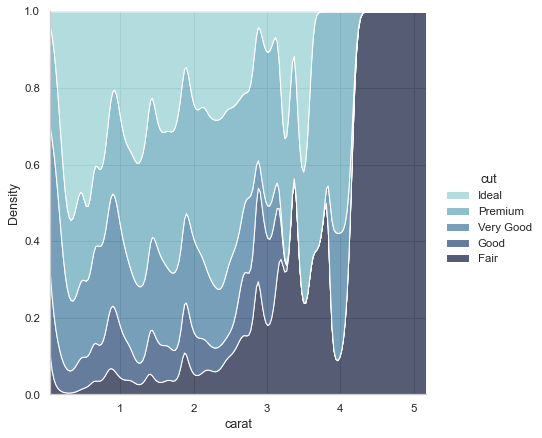
seaborn components used: set_theme(), load_dataset(), displot()
import seaborn as sns
sns.set_theme(style="whitegrid")

# Load the diamonds dataset
diamonds = sns.load_dataset("diamonds")

# Plot the distribution of clarity ratings, conditional on carat
sns.displot(
    data=diamonds,
    x="carat", hue="cut",
    kind="kde", height=6,
    multiple="fill", clip=(0, None),
    palette="ch:rot=-.25,hue=1,light=.75",
)
Facetted ECDF plots
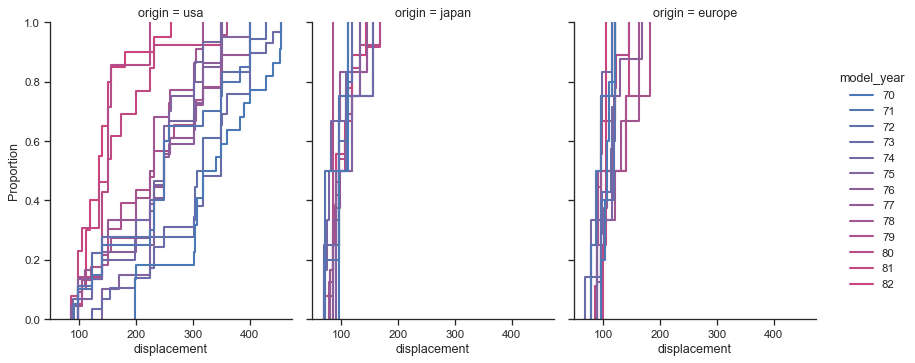
seaborn components used: set_theme(), load_dataset(), blend_palette(), displot()
import seaborn as sns
sns.set_theme(style="ticks")
mpg = sns.load_dataset("mpg")

colors = (250, 70, 50), (350, 70, 50)
cmap = sns.blend_palette(colors, input="husl", as_cmap=True)
sns.displot(
    mpg,
    x="displacement", col="origin", hue="model_year",
    kind="ecdf", aspect=.75, linewidth=2, palette=cmap,
)
반응형