


반응형
Grouped boxplots
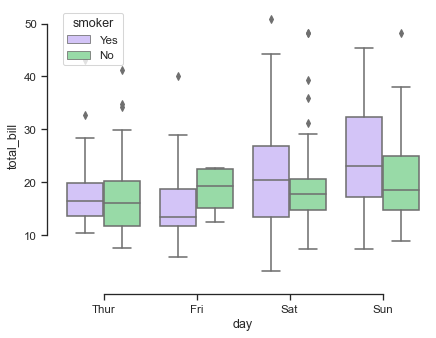
seaborn components used: set_theme(), load_dataset(), boxplot(), despine()
import seaborn as sns
sns.set_theme(style="ticks", palette="pastel")

# Load the example tips dataset
tips = sns.load_dataset("tips")

# Draw a nested boxplot to show bills by day and time
sns.boxplot(x="day", y="total_bill",
            hue="smoker", palette=["m", "g"],
            data=tips)
sns.despine(offset=10, trim=True)
Horizontal boxplot with observations
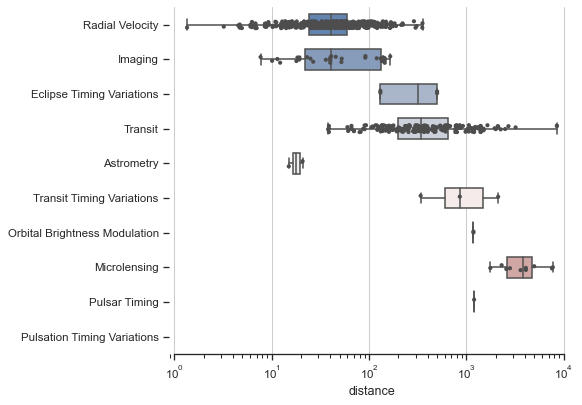
seaborn components used: set_theme(), load_dataset(), boxplot(), stripplot(), despine()
import seaborn as sns
import matplotlib.pyplot as plt

sns.set_theme(style="ticks")

# Initialize the figure with a logarithmic x axis
f, ax = plt.subplots(figsize=(7, 6))
ax.set_xscale("log")

# Load the example planets dataset
planets = sns.load_dataset("planets")

# Plot the orbital period with horizontal boxes
sns.boxplot(x="distance", y="method", data=planets,
            whis=[0, 100], width=.6, palette="vlag")

# Add in points to show each observation
sns.stripplot(x="distance", y="method", data=planets,
              size=4, color=".3", linewidth=0)

# Tweak the visual presentation
ax.xaxis.grid(True)
ax.set(ylabel="")
sns.despine(trim=True, left=True)
Plotting large distributions
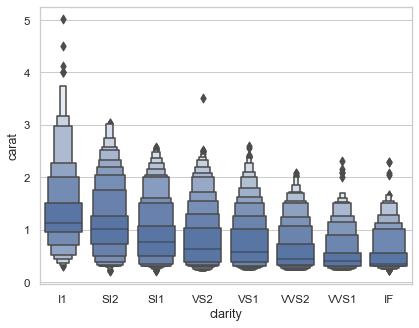
seaborn components used: set_theme(), load_dataset(), boxenplot()
import seaborn as sns
sns.set_theme(style="whitegrid")

diamonds = sns.load_dataset("diamonds")
clarity_ranking = ["I1", "SI2", "SI1", "VS2", "VS1", "VVS2", "VVS1", "IF"]

sns.boxenplot(x="clarity", y="carat",
              color="b", order=clarity_ranking,
              scale="linear", data=diamonds)
반응형